Health Care Blog (Page 5)
Posted in Myocardial Infarction | 21/02/2015
Our groups included patients developing VF during AMI. We separated them according to preestablished electrocardiographic criteria into two groups which were comparable in age, coronary risk factors, and previous cardiac diseases. Those two types of tachyarrhythmias could be correlated with specific phases of infarction based upon electrocardiographic natural evolution of AMI. Increased ventricular vulnerability to fibrillation can occur secondary to a complete coronary occlusive event Investigations designed to assess the correlation between ST-segment alterations and coronary dynamics demonstrated that ST-segment elevation with a peaked positive T wave is an initial electrocardiographic expression of transmural myocardial ischemia, resulting from sudden reduction of coronary blood flow. The fact that less than 20 percent of the patients were found to have type 1 arrhythmia may suggest that in a substantial number of patients, it takes place during the so-called prehospital phase, whereas type 2, the multiform variety, was found to be the dominant…
Read more
Posted in Myocardial Infarction | 20/02/2015
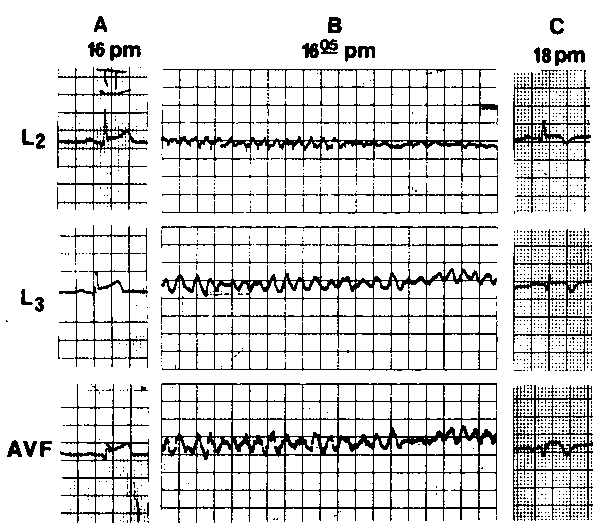
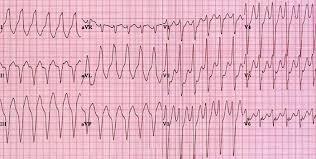
Ventricular fibrillation has been defined by Sura-wicz as chaotic, asynchronous fractionated activity of the cardiac ventricles. Two electrocardiographic patterns of VF were characterized by Friedberg in the 1960s; the first was characterized by fairly uniform undulatory rhythm with amplitude of 8 to 10 mm and frequency of 130 to 300 beats per minute with no isoelectric interval, sometimes termed ventricular flutter. In the second type the main electrocardiographic features were irregular oscillations with continuous change in amplitude, width, and configuration, representing bizarre QRS complexes, where the ST segment and the T wave cannot be differentiated from the entire ventricular complex. In 1966, a French author defined another distinct form of ventricular tachyarrhythmia using the term, “torsade de pointeswhose main characteristics consist of paroxysms of ventricular tachycardia in which the QRS axis undulates over runs of 5 to 20 beats around an imaginary isoelectric line.
Read more

Posted in Myocardial Infarction | 19/02/2015
Group 1 (Table 1) included seven male patients with ages ranging from 39 to 79 years (mean, 58 years). Two patients had had previous myocardial infarction, four had effort-induced or unstable angina, and two were free of cardiac symptoms. The AMI was anterior in three patients and inferior, inferolateral, extensive posterior, and anteroseptal wall in the remaining four patients, respectively. None of these was given diuretics prior to the onset of VF. Six patients developed VF during stage 1 of infarction, and in the remaining patient, VF was documented following the appearance of pathologic Q waves (Table 2). The mean duration of time between admission and VF occurrence was 2.5 hours (range, 0 to 16 hours). An exception is patient 7, where VF was observed 16 hours after admission. Of the seven patients, only one (patient 3) had recurrent episodes of VF. Direct-current shocks were remarkably efficient in the restoration…
Read more
Posted in Myocardial Infarction | 18/02/2015
Selection of Patients From the initial population studied, 35 were excluded because of the presence of other factors known to predispose or to be associated with ventricular arrhythmias. The criteria for exclusion that were applied (developed prior to the examination of the patients data) were as follows: (a) patients treated with group 1 antiarrhythmic drugs, digoxin, amiodarone, or sympathomimetic drugs prior to the onset of VF, with or without prolonged Q-Tc interval; (b) patients with previously known ischemic cardiomyopathy, ventricular arrhythmias, congestive heart Mure, or left ventricular aneurysm; (c) patients with serum potassium concentration of less than 3.5 mmol/L or more than 5.5 mmol/L (samples of blood were taken on admission); (d) patients with severe hypotension or cardiogenic shock; (3) patients with catheter-induced VF; and (f) patients in whom stages of AMI could not be recognized (complete left bundle-branch block, etc).
Read more
Posted in Myocardial Infarction | 17/02/2015
Itoo Distinct Clinical and Electrocardiographic Features Ventricular fibrillation (VF) is the major cause of cardiac death within the early hours of evolving infarction or ischemia. A number of clinical studies have attempted so far to evaluate the prognostic significance of primary VF complicating acute myocardial infarction (AMI), the role of sympathetic activity, the tendency for recurrence, and prophylactic treatment. Numerous studies have been designed in an attempt to define the predictive values of predisposing factors, such as the infarcts site and size, abnormalities of heart rate and conduction, prolonged corrected Q-T interval (Q-Tc), R-on-T phenomenon, warning arrhythmias, and metabolic disorders. None of these studies has commented on significant variability of fibrillation amplitude and configuration and their interpretation in relation to various stages of infarction. add comment
Read more
Posted in Myocardial Infarction | 16/02/2015
Amiodarone in Acute Myocardial Ischemia-Infarction There are few data regarding the effect of amiodarone on heart rate in patients with acute myocardial infarction or ischemia. Moreover, in no clinical studies to our knowledge was amiodarone given specifically for the treatment of sinus tachycardia. Temam gave IV amiodarone to 50 patients with acute myocardial ischemia-infarction. He found a mean decrease of 15 percent in the heart rate in one hour without significant fall in blood pressure. Lotto et al reported their experience with 12 patients with acute myocardial infarction in whom (3-blockers were contraindicated. Heart rate decreased in all but one patient (111 ±14 to 99 ±11.8 beats/min). This effect was more marked in patients with high initial heart rates and was almost absent when the initial heart rate was below 80 beats/ min. There was a linear correlation between the reduction in heart rate caused by amiodarone and the initial…
Read more
Posted in Myocardial Infarction | 15/02/2015
Effect of Amiodarone on Sinus Node Function It has been widely shown that the administration of oral amiodarone increases sinus cycle length and usually prolongs the sinus node recovery time and the sinoatrial conduction time. Moreover, the majority of published series on oral amiodarone have reported among its side effects the development of severe sinus bradycardia, sinus pauses, or sinoatrial block requiring the discontinuation of the medication or the need of permanent pacing. The effect of IV amiodarone on heart rate is less clear. Several studies have shown little or no effect of IV amiodarone on sinus cycle length. Most of these patients had heart rates within the normal range. However, similar studies have demonstrated a significant reduction m heart rates following the administration of amiodarone. Source
Read more