Pressure Support Compensation and Demand Continuous Positive Airway Pressure: Pressure Support Compensation for Added Inspiratory Work
Pressure Support Compensation for Added Inspiratory Work
Three different Puritan-Bennett 7200 ventilators were tested. All were calibrated to the manufacturers specification, equipped with a standard patients circuit and humidifier (Cascade I, Puritan Bennett Co.), and set in the CPAP = 0 mode with a sensitivity of 0.5 cmHsO (fractional concentration of oxygen in the inspired gas [FIoJ = 0.21). Shiley low-pressure cuffed endotracheal tubes (length, 30 cm) with internal diameters of 7, 8, and 9 mm were used.
The mechanical model was cycled to generate a sinusoidal flow pattern with a tidal volume of500 ml at rates of15, 20, 25, 30, and 35 breaths per minute with an inspiration-to-expiration (I:E) time ratio of approximately 1:2 (actual Vt/Ti=0.38, 0.54, 0.64, 0.74, 0.83 L/s, respectively). At each respiratory rate, work was measured with (1) an open airway, (2) each size of endotracheal tube alone, and (3) each size of endotracheal tube plus the ventilator circuit.
For each condition of respiratory rate and endotracheal tube size, pressure support was added with each ventilator. When the pres-sure-support option is selected with the Puritan-Bennett 7200 ventilator, it is operative during the inspiratory phase of any spontaneous breath. When inspiratory effort is sensed as a negative deflection of Paw, pressure support is activated. The target Paw is the sum of the positive end-expiratory pressure (PEEP) and the set pressure support. Pressure support is terminated if Paw exceeds the target Paw by 1.5 cmH20 or when inspiratory flow is 5 L/min or less. Pressure support can be applied over a range of 0 to 30 cmHaO in increments of 1 cmH20.
Without pressure support, there is added work to the respiratory system (Waw is positive) due to the endotracheal tube and ventilator circuit resistance (Fig 2A). As pressure support is increased, Wrs decreases, and Wv increases. We reasoned that the optimal level of pressure support was that level at which the Waw was equal to zero (Wrs=Wv) (Fig 2B). With higher levels of pressure support, Wrs is further decreased and Wv increased, resulting in most of the work on the airway during inspiration being done by the ventilator (Waw is negative), as in standard pressure-cycled mechanical ventilation (Fig 2C).
With each condition of inspiratory rate and tube size, the pressure support was increased until the net Waw was calculated as zero. A linear relationship was established between this optimal level of pressure support and the Vt/Ti for each endotracheal tube and ventilator using the method of least squares.
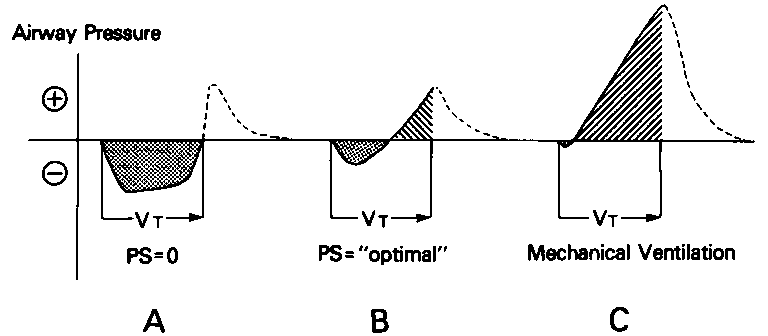
Figure 2. Airway pressure-volume curves with increasing pressure support. Schematic shows airway pressure-volume curves generated by mechanical breathing model with endotracheal tube and ventilator circuit. Shaded areas represent Wrs; and hatched areas represent Wv without pressure support (A) and with “optimal’’ pressure support (that level at which Wrs-Wv and Waw = 0) (B). With higher levels of pressure support (C), Waw is negative (ie, performed mostly by pressure-support system).
Category: Airway
Tags: airway, endotracheal tubes, pressure