Physiological Response to Moderate Exercise Workloads in a Pulmonary Rehabilitation Program in Patients With Airflow Obstruction: Statistical Analysis
 Statistical Analysis
Prior to statistical analysis, normality frequency plots were performed to examine the data distribution. Data are presented as means ± SD, unless otherwise indicated. Percentage differences in physiologic variables before and after the training intervention were calculated according to the following formula: (poststudy mean value-prestudy mean value/prestudy mean value) X 100. Comparisons between baseline and outcome measurements in the training group were made using paired t tests. Additionally, within the training group, comparisons for a number of physiologic variables were evaluated as a function of baseline airway function (FEV1 > 40% predicted vs < 40% predicted) by unpaired t tests. Correlations between measured physiologic variables and airway function were assessed by Pearson’s correlation coefficient.
As secondary outcome assessments, physiologic measurements between the training and nontraining control groups were compared using Student’s unpaired t tests at the beginning of the study prior to the training intervention; between-group mean differences are presented with 95% confidence intervals. Additionally, paired t test comparisons were made at baseline and at 12 weeks for a number of physiologic variables within the nontraining control group. The level of significance was set at p < 0.05. fully
Results
Although the training and nontraining control groups were not prospectively randomized, they were well matched for all variables other than age (Table 1). Among the 60 patients assigned to the training group over the 12-week period, 20 patients improved on their baseline training prescription by 50%, 27 patients improved by 25%, and 13 patients did not improve. The percentage attendance for the training cohort throughout the study was 90 ± 9.
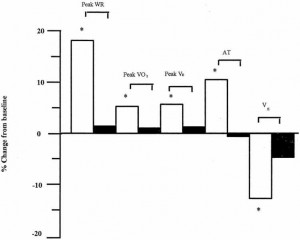
There was significant improvement in exercise tolerance as assessed by the incremental cycle er-gometer test within the training group. Peak WR increased by a mean of 18%; this was accompanied by significantly higher peak values for V02, VC02, VE, and HR (Table 2; Fig 2). By contrast, none of these variables significantly changed in the nontraining control group (Table 2; Fig 2).

Figure 2. Changes from baseline in a number of physiologic responses during the incremental exercise test following the 12-week study period for the training (□) and nontraining control (■) groups. *p < 0.05; comparisons are within, not between, group.
Category: Airflow Obstruction
Tags: COPD, exercise training, pulmonary rehabilitation